Search
Posts con la etiqueta ‘Philippines’
Philippines Launches a National MPI
In the initial methodology, there are 13 indicators identified across the following four dimensions:
I. Education: • School attendance • Educational attainment
II. Health and Nutrition: • Hunger • Food consumption • Health insurance
III. Housing, Water and Sanitation: • Ownership of assets • Toilet facility • Source of water supply • Tenure status of dwelling • Housing materials • Electricity
IV.Employment: • Underemployment • Working children not in school
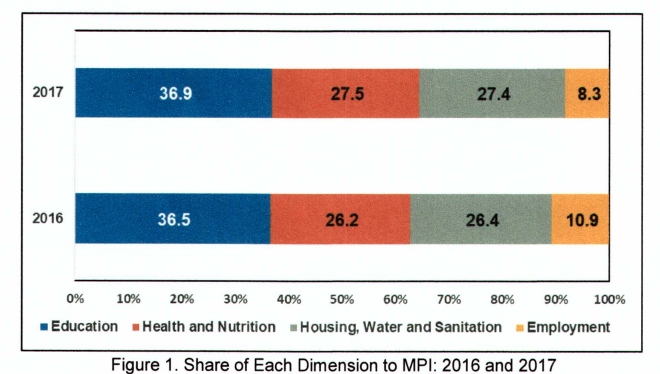
The Education dimension had the largest share or contribution to overall deprivation (MPI) at 36.5 percent and 36.9 percent in 2016 and 2017, respectively. The Health and Nutrition dimension comes next with a contribution of 26.2 percent in 2016 and 27.5 percent in 2017. The share of Housing, Water and Sanitation to MPI was 26.4 percent in 2016 and 27.4 percent in 2017. Employment dimension, on the other hand, had the least share to MPI.
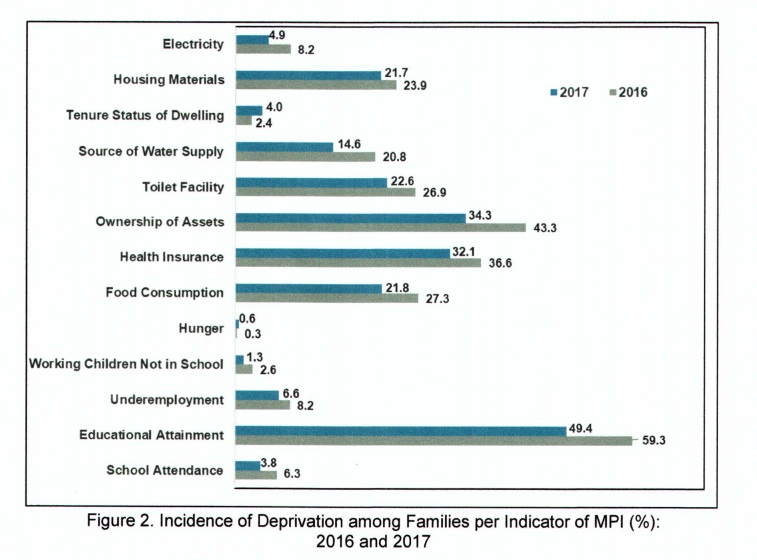
Among the 13 indicators, educational attainment consistently had the highest incidence of deprivation among families for 2016 and 2017 at 59.3 percent and 49.4 percent, respectively. These mean that 6 out of 10 families in 2016 and 5 out of 10 families in 2017 were deprived of basic education; that is, 6 out of 10 families had at least one family member aged 18 years old and above who did not complete basic education in 2016 and 5 out of 10 in 2017. Conversely, hunger had the least incidence at 0.3 percent and 0.6 percent in 2016 and 2017, respectively.
In 2017, the following indicators had the highest incidence of deprivation among families for the other dimensions:
It must be noted, though, that there was an increase in incidence of deprivation from 2016 to 2017 in the following indicators and dimensions:
The Multidimensional Poverty Index
A Filipino is identified as multidimensionally deprived if he or she is deprived in at least one third of the indicators or at least four of the 13 indicators. In 2017, the multidimensionally deprived Filipinos or the proportion of Filipinos deprived in at least four out of the 13 indicators (headcount ratio) was estimated at 17.3 percent.
In 2016, it was recorded at 23.9 percent. In terms of the intensity of their deprivation, on average, they were multidimensionally deprived in 41.2 percent and 43.2 percent of the indicators in 2017 and 2016, respectively.
The MPI is calculated by multiplying the headcount ratio (the proportion of Filipinos identified as multidimensionally deprived) by the average intensity of deprivation among those who are deprived. MPI reflects both the share of people and the degree to which they are deprived. In 2016 and 2017, the MPI was estimated at 10.4 and 7.1, respectively.
Note: The Philippine Statistics Authority (PSA), in consultation with its Inter-Agency Committee on Poverty Statistics, developed an initial methodology for estimating the multidimensional poverty index based on the Alkire and Foster methodology, Recognizing that the MPI indicators are crucial to inform policy and planning, PSA intends to collect more relevant information as inputs to further enhance the MPI methodology and consult with stakeholders to come up with an official methodology to be recommended to the PSA Executive Board for approval.
Picture: Brian Evans.


Recent Comments