Search
Multidimensional Poverty Reduction in India between 1999 and 2006
This article is a summary of the essay published in World Development entitled ‘Multidimensional Poverty Reduction in India between 1999 and 2006: Where and How?’ by Sabina Alkire and Suman Seth (also available as an OPHI Working Paper) and presents the key findings of an analysis of changes in multidimensional poverty through the application of an adaptation of the global Multidimensional Poverty Index. This same analysis is replicated for over a 100 countries.
India has witnessed high economic growth since the 1980s, accompanied by a reduction in the share of people living in income poverty. Poverty, however, has multiple dimensions. This article explores the improvements experienced by the Indian population in different social deprivations other than income. The analysis from this multidimensional perspective shows the prevalence of multiple overlapping deprivations among the poor.
Analysis of Multidimensional Poverty in India: Key Findings
Poverty in India has traditionally been measured in terms of consumption and expenditure, centred on the ability to spend on goods and services rather than the capability to enjoy valuable beings and doings (Sen 1985). All this, despite methodological revisions, multiple debates, and the acknowledgements of the multidimensional nature of poverty and the need for inclusive growth that have taken place in the country.
We know that deprivation in per-capita expenditure is an important dimension of poverty. However, surprisingly, income poverty does not accurately proxy other deprivations: empirical studies have shown that significant percentages of those who are multidimensionally deprived are not income poor and vice versa (Laderchi, Saith, and Stewart 2003; Alkire and Kumar 2012). Therefore, there is a need to supplement income poverty measurement with multidimensional poverty measures that capture the joint distribution of deprivations across the population. Furthermore, such measures can be used to track national poverty levels and the changes by region, caste, and dimension, amongst others.
Sabina Alkire and Suman Seth created a Multidimensional Poverty Index for India (MPI-I) that is strictly comparable across two sufficiently separated time periods, allowing us to see clearly the changes in multiple dimensions. Out of the ten indicators used, six are identical to those of the global MPI, and the other four (nutrition, mortality, school attendance, and flooring material) were adjusted due to differences in the two National Family Health Survey datasets.
Based on these comparable indicators, the findings show that, nationally, multidimensional poverty has fallen in India between 1999 and 2006. The percentage of MPI-I poor people shows a statistically significant decrease of 1.2 percentage points per year, from 56.8% in 1999 to 48.5% in 2006. These findings supplement the understanding of reductions in national income poverty.
This reduction by 1.2 percentage points per year has been much slower than that achieved by some countries in the region, which are significantly poorer in terms of income. For example, Nepal reduced the percentage of poor people between 2006 and 2011 by 4.1 percentage points per year, while Bangladesh’s poverty rates decreased by 3.2 percentage points per year between 2004 and 2007. Even India’s best performing states – Kerala and Andhra Pradesh – did not progress as fast as Nepal or Bangladesh in reducing multidimensional poverty.
The authors also investigate where and how this reduction took place. To understand where, they explored the changes in poverty across various population subgroups, including states, rural/urban areas, castes, religions, and various household characteristics. The study found that the reduction in multidimensional poverty has not been uniform across all subgroups. The poorer groups, be they the poorer states, castes, or religious groups, have shown slower progress than the initially better-off subgroups. These findings contrast with the pattern of national income poverty reduction across states, where poorer states did not necessarily record slower progress.
For example, among states, the better-performing states in 1999, such as the South Indian states of Himachal Pradesh, Gujarat, and Maharashtra, reduced multidimensional poverty more than the initially poorer states, such as Uttar Pradesh, Madhya Pradesh, Rajasthan, and Bihar. This pattern is in contrast to the pattern of change in income poverty across states between 1993–94 and 2004–05, in which the poorest states reduced income poverty the most.
Among castes and tribes, there have been statistically significant reductions in multidimensional poverty across all groups, but the reduction was slowest for the poorest group, the Scheduled Tribes. Similarly, across religious groups, Muslims, the poorest subgroup in 1999, saw the least reduction in poverty over the seven year period.
The poorer groups, be they the poorer states, castes, or religious groups, have shown slower progress than the initially better-off subgroups. These findings contrast with the pattern of national income poverty reduction across states, where poorer states did not necessarily record slower progress.
In addition, the MPI-I allows the decomposition of the population based on household characteristics, generating additional insights. When considering the population across different household sizes, the essay found that in 1999 multidimensional poverty tended to be higher among larger households and that the reduction in poverty had been slowest for these larger and poorer households.
Also, the share of the population living in female-headed households increased from 7.6% in 1999 to 10.8% in 2006. In 1999, multidimensional poverty among female-headed households was lower than male-headed households. In contrast, multidimensional poverty was higher among female-headed households in 2006, bucking the national downward trend. On the other hand, there was a statistically significant decrease in poverty among male-headed households.
In order to understand how poverty reduction has taken place, the investigators broke down the index into its different components: the multidimensional poverty incidence ratio and the average intensity of deprivation among the poor . The study found that the reduction in multidimensional poverty was mainly caused by a significant reduction in the proportion of people living in poverty (incidence) instead of by a reduction in the intensity of the deprivations amongst the poor. Comparing across states, Alkire and Seth found that some of them, for example Andhra Pradesh, have reduced poverty mostly by reducing the intensity of poverty among the poor; whereas other states, for example Kerala, have reduced poverty by reducing the proportion of poor people. Nationally, absolute improvements in certain living standards indicators – such as access to electricity, access to water, type of housing, and access to improved sanitation facilities – have been larger than in other social indicators.
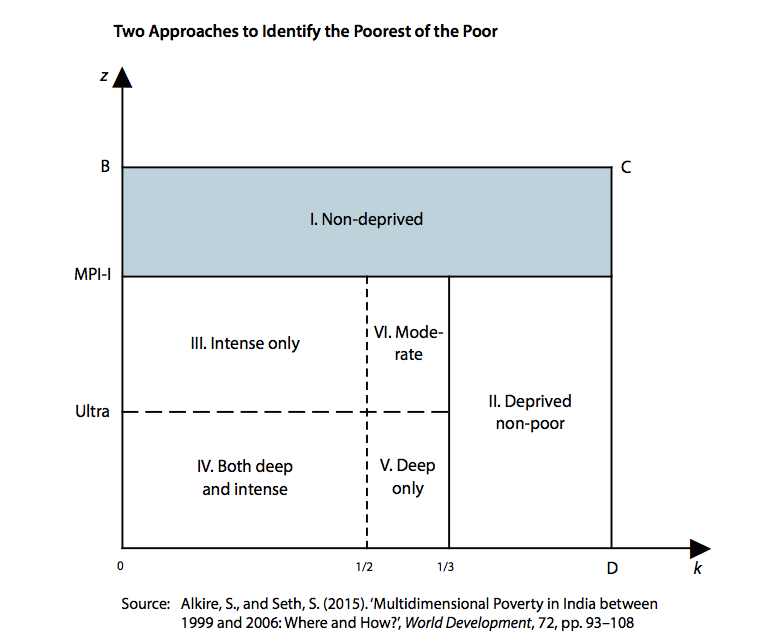
In order to analyse the situation among the poorest of the poor, subgroups among the poor were identified using two additional criteria. The first one identifies the poorest people in terms of the intensity of their deprivation. A stricter criterion is used to identify those who have a larger number of deprivations – suffering, in this case, deprivations in half or more of the indicators instead of the number used for identifying multidimensional poverty, which is a third of them. These people are identified as intensely poor.
The second identifies the poorest people in terms of being more deeply deprived in each of the indicators (those further away from the deprivation cut-off line for each indicator). For example, if a body mass level is used in the original analysis in order to determine if a person suffers deprivation in terms of nutrition, a considerably lower level of body mass is used for this specific analysis. The essay refers to these people as deeply poor.
These two subgroups of the MPI-I poor do not coincide with each other, but both show statistically significant reductions in the proportion of people considered the poorest of the poor. In fact, the researchers found that the reduction in the proportion of multidimensionally poor people has been accompanied by relatively faster reductions in both the proportion of the intensely poor and the deeply poor. The proportion of the multidimensionally poor has gone down by 14.6% between 1999 and 2006; whereas the shares of intensely poor and deeply poor have gone down by 20.3% and 26.9%, respectively, during the same period.
The authors classified the MPI-I poor people into four groups: those who are both intensely and deeply poor, those who are deeply but not intensely poor, those who are intensely poor but are not deeply poor, and those who are moderately poor. An alarming finding was made: In 1999 nearly 66% of India’s poor people were deeply or intensely poor – or both. Happily, the share of people who are both deeply and intensely poor has gone down considerably. However, in the year 2006, 29.8% of the population was still either intensely poor or deeply poor, and 13.9%, or more than 140 million people, were simultaneously intensely poor and deeply poor. This number is larger than the total population of Japan.
To Be Taken into Account
The article by Alkire and Seth shows the differing patterns of change in income poverty and multidimensional poverty at the state level. However, the authors express the need to explore this relationship at a more micro-level. In the case of India, neither of the nationally representative surveys or inter-temporal datasets allows such comparisons. The National Family Health Surveys do not collect any information on household incomes or consumption expenditures, and the National Sample Surveys do not collect any information on the anthropometric indicators such as the nutritional status of household members.
Furthermore, the authors indicate that rural multidimensional poverty has decreased much faster than urban poverty. However, at the same time there has been a large migration of people from rural areas to urban areas. This analysis is pending in the research agenda for India.
Editor’s note: The analysis of the intensely and deeply poor in India has been replicated recently by OPHI for 102 countries with a view to paying special attention to the situation of the poorest of the poor and leaving no one behind (see Table 1.2 for detailed data by country, columns k to n).


