Search
Multidimensional Poverty in Sub-Saharan Africa


In June 2016, the Islamic Development Bank and the Oxford Poverty and Human Development Initiative published the report ‘Multidimensional Poverty Assessment in IDB Sub-Saharan African Member Countries’. What is the state of poverty in the region? Where are the people with largest deprivations located? The answers to these questions are crucial to formulating adequate policy responses for one of the poorest regions of the world.
The global Multidimensional Poverty Index (MPI), launched in 2010 and published by the Oxford Poverty and Human Development Initiative (OPHI) and the United Nations Development Programme (UNDP), assesses people’s deprivations in ten indicators, which are organized into three dimensions: education, health and living standards. In 2015, 101 countries were analysed, 43 of which were members of the Islamic Development Bank (IDB) (from a total of 57 of IDB members). Among the IDB member countries analysed, 22 are situated in sub-Saharan Africa.
 The analysis established that 264.3 million people (61.9% of the population) in these sub-Saharan countries are multidimensionally poor. Of these, 65.3% live in West Africa, 17.4% in East Africa, 10.8% in Central Africa, and 6.5% in Southern Africa. Given its large population, Nigeria, situated in West Africa, accounted for a third of all multidimensionally poor people in sub-Saharan African member countries of the IDB (87.4 million people). The country with the highest incidence of multidimensionally poor people is Niger (89.3% in 2012), followed by Chad (87.2% in 2010).
Multidimensional Poverty at the Subnational Level
The report illustrates the global MPI’s powerful descriptive capacity stemming from its ability to decompose results by subgroup and measure changes in poverty levels over time. As multidimensional poverty levels, composition, and trends vary greatly, the analysis indicates that sub-Saharan Africa should be considered not only on a regional basis, but also country by country and by subnational regions within each country.
While no IDB country exhibits a proportion of multidimensionally poor people higher than 90%, the same is not the case at the subnational level, with 39 of the 222 subnational regions within these countries having higher rates.
The poorest subnational region is Salamat, located in the southeast part of Chad, a landlocked region just south of the Sahel that borders the Central African Republic. According to 2010 data, 98% of Salamat’s population is multidimensionally poor. On average, each poor person is deprived in 73% of MPI indicators, which also makes it the region with the highest intensity of poverty. The second poorest subnational region is Est in Burkina Faso, where 97% of people are multidimensionally poor and the average intensity is 72%. This subnational description, drawing on the global MPI, serves to make pockets of poverty visible; pockets that remain invisible in other types of analyses.
Multidimensional poverty in sub-Saharan Africa is predominately rural (82.2%) and significantly higher than monetary poverty (73.8%).
What is the Composition of Multidimensional Poverty?
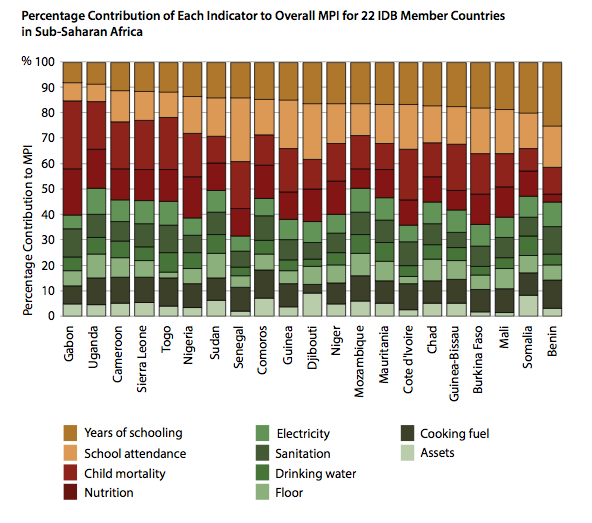
The global MPI also analyses the contribution of each indicator to overall poverty. It is interesting to observe that the composition of poverty for each country is different, showing the challenges each country faces in addressing their situation. In countries such as Gambia, Cote d´Ivoire, and Burkina Faso, the contribution of each indicator tends to be relatively equal. In countries such as Gabon, deprivations in health indicators dominate the MPI, while deprivations in education contribute the most to poverty in Benin and Senegal. Deprivations in living standards contribute 45% or more to the MPI in ten countries and are highest in Uganda, Sudan, and Mozambique.
The analysis established that 264.3 million people (61.9% of the population) in these sub-Saharan countries are multidimensionally poor.
The report also reveals that cooking fuel was the indicator that contributed the most to multidimensional poverty, followed by deprivation in sanitation. Furthermore, deprivations in electricity were quite prominent in these countries. Deprivations in education and child mortality also continue to be a challenge.
As mentioned above, national compositions of poverty can be disaggregated by subnational regions to provide rich information on the regional variations of poverty. This information can be used in the formulation of targeted public policies. For instance, the analysis of the composition of poverty in Salamat and Moyen Chari, two regions in Chad, shows that the overall contribution of deprivations in education are much larger in Salamat than in Moyen Chari. Therefore, Salamat requires a bigger investment in education than Moyen Chari. These important differences remain hidden when only national averages are considered. These types of analysis could be used by each country to understand the particularities of the challenges exposed by multidimensional poverty at a national level when complemented with subnational data showing the composition of the MPI.
Destitution: The Poorest of the Poor
The report also presents data regarding destitution in 20 of the 22 African countries of the IDB. To measure destitution, the deprivation cut-offs of each indicator were adjusted to reflect more critical deprivation levels (e.g., that two or more children under five have died in the household rather than one, as used by the global MPI). The destitute are those who experience deprivations in at least one-third of the indicators using the destitution cut-offs.
The analysis of the 20 countries for which data is available shows there are 150 million destitute people, representing 36.2% of the total population or 58.8% of multidimensionally poor people in those countries. In turn, of those identified as destitute, 46.6% have experienced the loss of two or more children, 29% have at least one household member suffering severe malnutrition, 45% have no household member who has completed even one year of schooling, and 41.5% live in households where all primary school-aged children are not attending school.
Also, most of them (89.5%) have no access to electricity, and 22.4% do not possess even the most basic assets (bicycle, radio, refrigerator, television, motorbike) or a car or truck.
The results indicate that almost 50% of the destitute practice open defecation, experiencing the shame, fear, insecurity, and humiliation that this entails. Furthermore, 60% have no access to safe drinking water or the source of water is located over 45 minutes away; 80.3% of the destitute have inadequate flooring in their house, and almost all use solid fuels for cooking. The sad truth is that none of the destitution indicators have, thus far, been shown to be irrelevant.
Niger is not only the poorest country in terms of the global MPI but also has the highest incidence of destitution among IDB African countries: 68.8% of its population lives in destitution. The percentages in Chad and Burkina Faso are also very high, at 65.8% and 57.5%, respectively. Nevertheless, this is not the case for all African countries; in Gabon, for instance, the percentage is 3.2%.
So, What Can We Do Now?
One third of people identified as multidimensionally poor live in sub-Saharan IDB member countries (out of the 101 countries analysed by the global MPI in 2015). It is also the region that shows the largest incidence and intensity of poverty. However, as mentioned above, the region should be analysed not only as a whole but also country by country and by the subregions within each country, as the level, composition, and trends of multidimensional poverty vary greatly. In order to implement sound public policies, the use of valuable global MPI information at both the national and subnational level is essential.
Governments must focus their programmes on reducing the incidence of poverty – that is, taking people out of poverty. But they are also urged to ‘leave no one behind’ by reducing the intensity of deprivations that poor people experience. It is clear that investment in public health, schools, and public services in rural areas should be strengthened. Public policies focused on the needs of the poor in such areas may have the largest impact in terms of the incidence and intensity of poverty.
Among the 22 IDB member countries from sub-Saharan Africa, deprivations in living standards affect a large number of people, especially cooking fuel, sanitation, electricity, flooring, and water access. Addressing these deprivations will not only make an impact on the MPI but will also contribute to reducing related aspects of poverty such as malnutrition and child mortality. Another prominent challenge is education.
This analysis clearly shows that poverty has many faces, from sanitation to electricity, education to living standards, and health. While an integrated plan to reduce poverty should be nationally led and monitored, the particular emphases and allocations should be regional. An MPI based on census data can be used to dig deeper and provide policy-relevant information on deprivation structures at an even more disaggregated level to inform and engage local governments. National government responses to multidimensional poverty thus need to be multilevel, involving lower levels of government as well as national leadership.
It is also important for international organizations to recognize that focusing on one dimension of poverty is insufficient. Growth alone does not necessarily result in multidimensional poverty reduction. Growth strategies need to be complemented by specific, multisectoral poverty reduction programmes that directly tackle the different dimensions of poverty.
Editor’s note: The most recent set of figures for the countries included in this study can be viewed in ‘Multidimensional Poverty Reduction among Countries in Sub-Saharan Africa’, soon to be published in Forum for Social Economics.
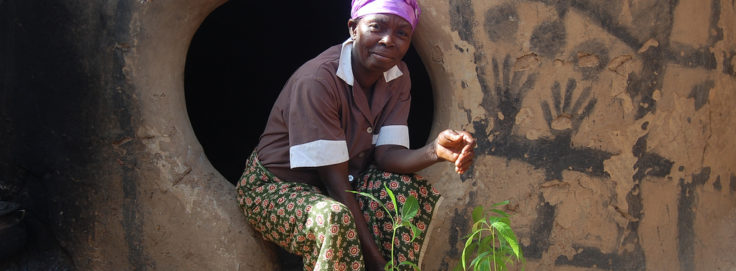
Photo: TREEAID.