Search
Andhra Pradesh Becomes the First Indian State to Adopt a Multidimensional Poverty Index

The Indian state of Andhra Pradesh published the first edition of its multidimensional poverty index (MPI) report this year in March. This pioneering venture made Andhra Pradesh the first state in the country to have undertaken a project exclusively to estimate an MPI at the state and district level, disaggregated by social categories and urban-rural areas, using the data collected through a household survey conducted specifically for this purpose.
Located on the southeast coast of India, Andhra Pradesh is the eighth largest state in the country in terms of area and is home to 50 million people. The erstwhile larger state of Andhra Pradesh used to be the fourth largest state in the India with a population of 84 million, but it was reorganised in 2014 into the present day states of Andhra Pradesh and Telangana.
The new state drafted a vision for itself to achieve key development milestones by 2019, 2022, and 2029. Tackling poverty in such a way that it leads not only to higher income but also better human development is a crucial thrust of this vision, demonstrated by the goal of ensuring access for all to 12 basic needs by 2019. In this context, the MPI was identified as a suitable metric to complement consumption-based poverty measures.
The latest official estimates of poverty, as calculated in accordance with the 2011–12 Tendulkar methodology based on consumption expenditure, pegged the headcount ratio at 9.2% of the population of erstwhile Andhra Pradesh (the state prior to its division). Prior to the recent estimation project, the latest available values of the MPI and related parameters were based on the data from the National Family Health Survey (NFHS) 2006, which put the headcount ratio at 41.6%, intensity of multidimensional poverty at 46.6%, and the MPI at 0.194. The division of the state and the lack of periodical data necessitated a deeper inquiry into poverty and its regional manifestation within the state.
Against this background, the state government commissioned a project in 2016 to estimate the MPI with three objectives: (1) to understand the multidimensional deprivations faced by its people, by location and social categories; (2) to support evidence-based policymaking in reducing multidimensional poverty; and (3) to benchmark itself against other states and countries with respect to the reduction in multidimensional poverty.
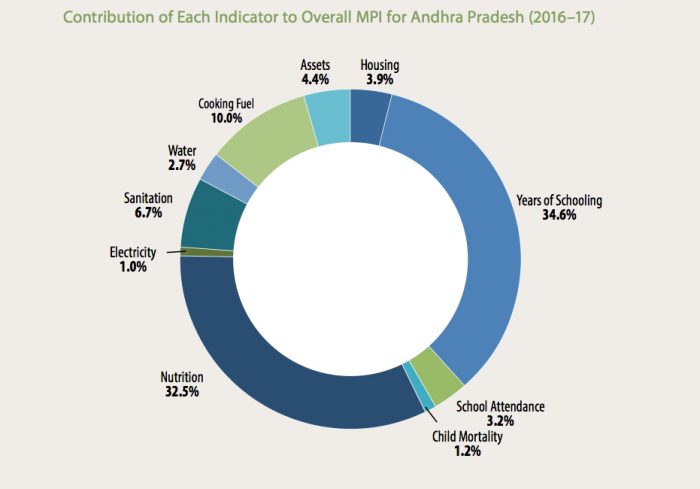
Years of schooling and nutrition deprivation, which contribute 34.6% and 32.5% to the overall MPI, respectively, are the major areas of concern for Andhra Pradesh.
Andhra Pradesh has adopted the global MPI structure with three dimensions (education, health, and living standards) and their associated 10 indicators. This enables the state to benchmark itself against a large number of countries for which the global MPI estimates are available. The dimensions of education and health have two indicators each (years of schooling and school attendance, and nutrition and child mortality, respectively); living standards has six indicators (access to electricity, improved sanitation, improved drinking water, flooring, clean cooking fuel, and asset ownership).
With technical assistance from the Oxford Poverty and Human Development Initiative (OPHI), the estimation exercise was led by the Vision Management Unit (VMU), a part of the Andhra Pradesh State Development Planning Society, which is an organ under the Planning Department of the state government. Sampling, questionnaires, the training programme for master trainers, field inspections, data processing and analysis, and publications were the responsibilities of VMU while the Directorate of Economics and Statistics of the state government carried out the household data collection.
The latest report, based on the 2016–17 household survey conducted by VMU, pegs the headcount of multidimensional poverty in the state at 21%. The headcount ratio is an important tool to gauge the proportion of the population who are MPI poor and are cumulatively deprived in at least one third of the 10 indicators across three dimensions.
The intensity of poverty captures the average number of deprivations faced by households, which in turn gives us information about how poor the MPI poor really are according to the 10 indicators. This additional information, along with the headcount ratio, makes MPI headline numbers robust and profound. The state’s intensity of poverty is 39.3% – in other words, multidimensionally poor persons in the state are deprived, on average, in 39.3% of the weighted indicators. The 13 districts are clustered tightly around this number with the lowest MPI intensity in Guntur at 37% and the highest in Kadapa at 41.4%.
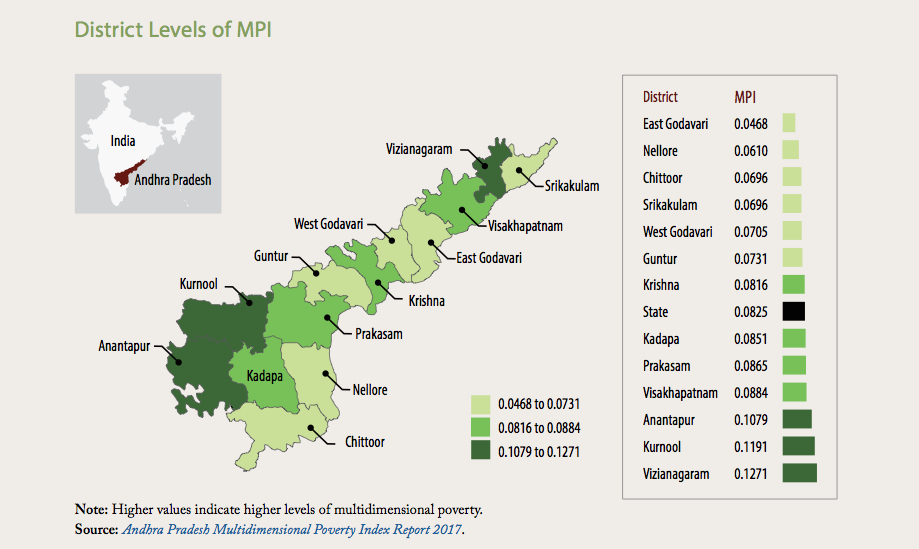
The MPI, which is a product of the headcount ratio and intensity, has a cutoff of 33% in this study for each household across the 10 weighted indicators – following the global methodology. The state MPI for Andhra Pradesh stands at 0.083 while the calculated MPI for India (OPHI 2017), derived from the 2011 India Human Development Survey (HDS), was 0.191. If Andhra Pradesh were to be compared and ranked alongside the 104 countries featured in the global MPI report by OPHI, it would have an equivalent rank of 51 and this would be above Bhutan, Myanmar, Nepal, India, and Bangladesh at 53rd, 55th, 63rd, 66th, and 68th, respectively. Interestingly, Vizianagaram district, which has the highest MPI in the state (0.127), still performed better than India taken as a whole, which has an MPI of 0.191.
Many of the 13 districts of the state have a population that is higher than several of the countries listed in the global MPI, and, therefore, such comparisons can provide the policymakers of the state an opportunity to exchange ideas and learn from the experiences of these nation-states in addressing the multidimensional nature of poverty.
The decomposition of the MPI is vital to identifying areas of concern and addressing the factors that contribute to the overall MPI of a region. In other words, this decomposition gives us a glimpse into the factors that affect the MPI poor the most. Years of schooling and nutrition deprivation, which contribute 34.6% and 32.5% to the overall MPI, respectively, are the major areas of concern for Andhra Pradesh.
Despite school attendance for children contributing only 3.2% to the MPI, years of schooling remains an issue, and this alludes to the fact that, while impressive headway has been made in the area of school enrolment for children, adult literacy remains an issue for the state.
The contribution to the MPI takes into account the weights given to individual indicators, and therefore the low contribution of child mortality highlights progress in terms of expanding government assistance for institutionalised deliveries, supplementary nutrition, and immunization.
The state’s present status as a power surplus state and its subsequent success in increasing access to electricity are captured by the low contribution of electricity deprivation to the index. Deprivation in cooking fuel, identified as a major concern for some districts, is expected to be much lower today as the state government has aggressively promoted liquefied petroleum gas (LPG in cylinders is widely used as an improved source of cooking in India) adoption in the 18 months between the inception of data collection for MPI estimation and the release of the MPI report.
The MPI estimation project of Andhra Pradesh demonstrates that any government with solid statistical systems and a small team for leadership and data analysis can undertake an exercise to measure the multidimensional deprivations of its people. The robust nature of the index, in conjunction with the specific household survey, is a new paradigm for states and districts in India in the quest to address regional and social category deprivations and poverty.
Furthermore, the MPI can be a robust tool for tracking the progress of states with respect to Sustainable Development Goal 1 – to end poverty in all its forms everywhere. The MPI report and the initiative to conduct an exclusive survey for MPI has the potential to become a template for other states in the country, which can also result in increasing the frequency of such studies and, in turn, helping in evidence-based policymaking.
Read Andhra Pradesh Multidimensional Poverty Index Report here.
Read 5th Dimensions Issue here.


