Search
National Roundtable to Reduce Poverty and Inequality in Colombia

By Diego Zavaleta and Roberto Angulo
Colombia launched its official multidimensional poverty measure in 2011 – the Colombian Multidimensional Poverty Index (C-MPI). The index was first used to establish specific policy goals for multidimensional poverty reduction (headcount ratio) as well as sector-specific targets within the National Development Plan – a mandatory and binding strategy that all incoming administrations must have approved by Congress at the beginning of their mandate. These goals were defined based on microsimulations using the public investment programme and sector-specific budgets. A crucial innovation in the Colombian process was the design of a monitoring system to track the progress of the Development Plan. This system was based on two main components. The first was a poverty roundtable – a board chaired by the President of Colombia and attended by all ministers and authorities whose work affected particular indicators of the C-MPI. The second component was a dashboard system where progress in different indicators, including the 15 components of the C-MPI, was reflected. The monitoring system based on the C-MPI indicators achieved important successes as a policy coordination and accountability tool.
Birth of a Monitoring System Informed by the C-MPI
In 2010, a new administration took office in Colombia. The incoming president, Juan Manuel Santos, had campaigned on a platform of poverty reduction, employment, and security, and thus instructed his team to define a National Development Plan based on these pillars. He also instructed that management instruments be designed to guarantee the fulfilment of the plan.
A crucial innovation for the poverty reduction pillar was the use of microsimulations to produce concrete goals for multidimensional poverty reduction.[1] Microsimulations had traditionally been used by the National Planning Department (Departamento Nacional de Planeación or DNP) for establishing income poverty reduction scenarios using general equilibrium models and simulations on the Quality of Life survey dataset. For multidimensional goals (and in the absence of a general equilibrium model that encompassed the dimensions of the index), the DNP team first simulated sector-specific results. These simulations were based on the public investment program for the following four years, as well as on the yearly budgets of the different public institutions involved. For this, an intensive consultation was carried out with each institution, analysing the concrete goals defined in the development plan, the on-going programs, the targeting rules for each social program in each sector, and the operational budgets. All this information was then used to identify the specific investments impacting each C-MPI indicator and to generate an estimate of how each indicator would be affected. For example, a specific percentage of the total amount of financial resources defined to increase health insurance coverage was identified as resources that would benefit MPI poor population. This amount was then used to calculate the number of household that would benefit from the increased coverage. These results were then applied to the microdata of the Quality of Life Survey to generate simulations of the indicators used in the C-MPI and overall results regarding the incidence of multidimensional poverty. Moreover, as the investment budgets were annual and defined by region, the microsimulations allowed the DNP to define a set of yearly goals.
The Poverty and Inequality Roundtable and the Dashboard proved useful tools for multidimensional poverty reduction through different channels.
Once the goals were established, the President’s Office contacted McKinsey & Company to help create a monitoring system that guaranteed the achievement of the National Development Plan goals. For the poverty reduction goals, McKinsey consultants contacted the DNP – who had already been working on different monitoring schemes – and worked alongside this department on two specific tools: a poverty roundtable (the Poverty and Inequality Roundtable or Mesa Transversal de Pobreza y Desigualdad), a special ministerial-level committee led by the President, and a dashboard that used a traffic- light system to show progress in different indicators and inform the roundtable. The poverty roundtable was designed to analyse the progress of the development plan in terms of poverty reduction and to make decisions informed by the dashboard. The joint work between the consultancy firm and the government proved successful, with McKinsey providing key advice in managerial aspects – how to report, who should attend, results-based decision-making – and acting as an independent coordinator of the project. The latter was essential, given the variety of high-powered authorities involved. McKinsey is a very influential firm in the country. This allowed it to be perceived as a technical and neutral broker and prevented political or power feuds between actors. For this particular project, the Director of the McKinsey oversaw negotiations with the individual ministers and directors. In turn, the DNP defined the components of the Poverty and Inequality Dashboard and developed the idea of the traffic-light system; this included deciding what indicators to evaluate, what type of data to use, how to define concrete milestones to monitor progress, and choosing the criteria to determine if poverty reduction was on track or not. The design of both instruments was completed in two months.
The Poverty and Inequality Roundtable in Action
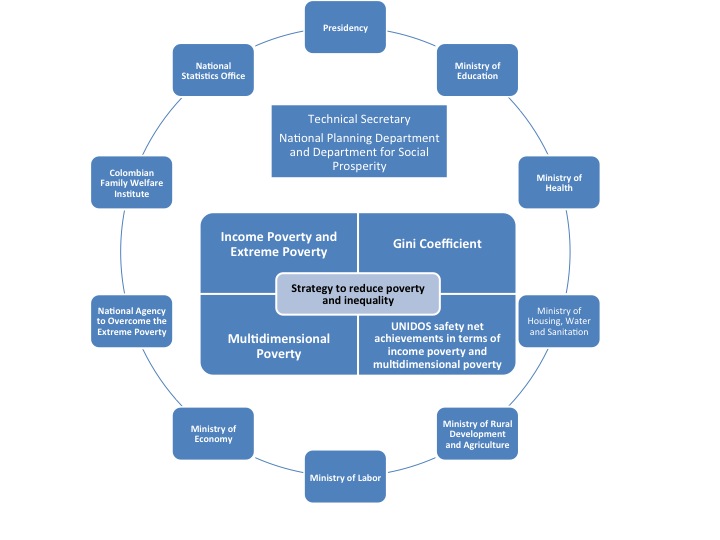
The Poverty and Inequality Roundtable was a high-level committee of the executive branch of government established to monitor poverty reduction in the country. The roundtable was convened and led by the President of Colombia to monitor the poverty reduction strategy. This committee met for the first time in 2011 and was convened at least twice a year for the rest of President’s Santos first term in office. The roundtable included all ministries and institutions directly involved in the national poverty and inequality reduction strategy, namely, the ministries of education, health, housing, rural development, labour, and economy, as well as three ministerial-level administrative departments: the DNP, the Department for Social Prosperity (Departamento para la Prosperidad Social or DPS), and the National Statistics Department (Departamento Administrativo Nacional de Estadística or DANE) (see Figure 1). Other institutions with relevant roles in the strategy, such as the Colombian Institute for Family Welfare or the former National Agency for Overcoming Extreme Poverty (Agencia Nacional para la Superación de la Pobreza Extrema or ANSPE), were also included depending on the agenda of the specific meeting. The DNP or DPS served as the technical secretariat for the roundtable. Participation in these meetings was compulsory for the ministers and directors – only on limited occasions were subordinates allowed to replace the highest-ranking official of the institution.
The roundtable reviewed the poverty and inequality dashboard and took corrective decisions if milestones were not being reached. The dashboard encompassed four overall indicators that could be updated on a yearly basis: the monetary poverty index, the Gini coefficient, the C-MPI, and the number of families that had overcome extreme poverty within the UNIDOS[2] safety net (Figure 2). These indicators corresponded to each of the official goals in the National Development Plan. The dashboard also exhibited the 15 individual indicators of the C-MPI. The annual results were contrasted with the estimates generated by the microsimulations in order to evaluate progress and take corrective actions if needed. Progress towards the achievement of these goals was illustrated through a traffic-light system, where a red dot attached to an indicator indicated a 0%–10% advance towards the quarterly or yearly goal, a yellow dot represented a 10%–25% advance, and a green dot represented 25% or more.[3]
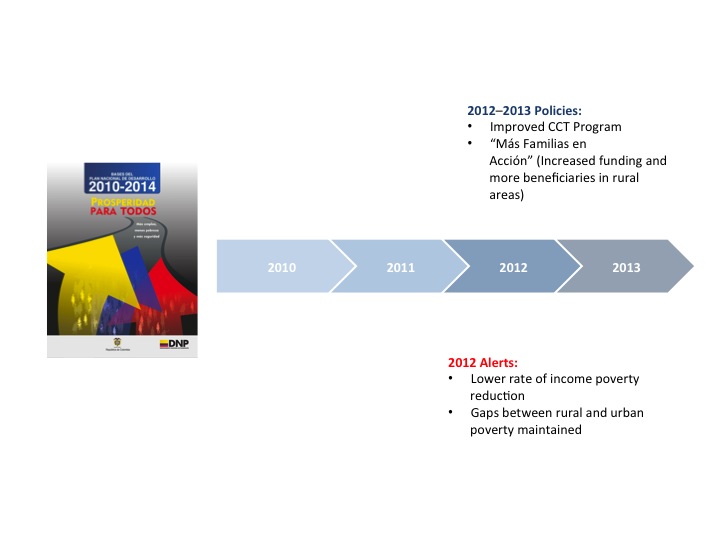
The analysis of progress in the C-MPI was particularly important in terms of monitoring and coordination due to the diversity of sector-specific targets that determined the overall multidimensional poverty reduction goal (Figure 3). Besides providing yearly updates of the C-MPI indicators based on new survey data, the DNP also generated quarterly results estimates. For this, the DNP used administrative data to generate proxies of quarterly results for each of the 15 C-MPI indicators. For example, the DNP received monthly reports from the Ministry of Health depicting the number of newly enrolled beneficiaries in the public health system and contrasted these figures with the initial estimates for the indicator “health insurance” of the C-MPI in the National Development Plan. Although this was an imperfect monitoring model, the exercise generated sufficiently good data to see the path towards the fulfilment of sector goals and established the precise problems preventing their fulfilment, if any emerged. A deviation from the path would trigger an alarm signal that would need to be addressed in the following roundtable session. Examples of these alarm signals can be observed in Figure 4.
The roundtable took place a number of times each year in two different forms. The first type of roundtable was convened by the President around March of each year to analyse the newly released poverty data (Colombia undertakes a new round of its main household survey each year and releases its results in the first months of the year). The discussion at this type of meeting revolved around the yearly results and the performance of each sector, with the DNP providing an explanation in case of underperformance. A press conference was held at the end of the meeting in which the President explained the results to the media. In between these yearly sessions, the roundtable gathered on different occasions to monitor progress using updates based on administrative data. During these meetings, the roundtable session was usually divided into three parts: analysis of the complete dashboard, a sector-specific discussion based on C-MPI dimensions and variables, and finally the review of one or two specific sectors of particular interest for the President at that point in time. For such meetings, the technical secretariat and each ministry or department leading the sector-specific discussion would deliver specific presentations, which had been revised by the technical secretariat so that any additional information could be incorporated in a timely manner and decisions could be taken during the meeting.
One example of the type of discussion generated within the roundtable is the development of the government housing program during Santos’ first term in office. The government’s first National Development Plan called for the construction of 1,000,000 houses in the following four years, a percentage of which (420,000) needed to be targeted to the population in extreme poverty. The then Minister of Housing proposed a series of macro-projects that reserved a percentage of future housing for the targeted population. However, once the roundtable was established and the projects were geo-referenced and contrasted against the poverty maps, it became evident that the proposed scheme would not deliver the established sector goal impacting the C-MPI; the macro-projects were planned for large urban conglomerates while most extreme poverty households were located in the rural area in Colombia. This mismatch generated strong debate between the Housing Ministry, the Planning Department, and the Ministry of Finance, illustrating the tension between traditional practices where key policies were defined by each sector and the coordination requirements of the new mechanism based on the C-MPI. In the end, the impasse was resolved through important modifications in key programs (e.g. Programa de Vivienda Gratuita) to guarantee that the housing program impacted the C-MPI indicators as needed. This impasse also helped accelerate the learning curve of the new mechanism as the rest of the attending ministers realised that the C-MPI was indeed going to be the central guiding instrument for poverty reduction and thus their plans needed to be clearly coordinated with the overall strategy.
Conclusion
The Poverty and Inequality Roundtable and the dashboard proved useful tools for multidimensional poverty reduction through different channels. First, they provided a practical and straightforward management tool for the highest authorities in the country to monitor their progress towards clearly established goals. The design of the C-MPI (with a clear policy orientation and very sensitive indicators to concrete policy outcomes) and the simplicity of the monitoring system exposed successes and failures of each responsible manager. This created a strong incentive for ministers and directors to complete their sector-specific goals in order to fulfil the National Development Plan (something that could not be done before using income poverty data as it is difficult to parse the specific policies behind income growth). Moreover, ministers (who usually tend to focus primarily on their own sectors) became exposed to the overall situation regarding poverty reduction in the country and the need to properly coordinate actions between sectors in order to enhance poverty reduction. Finally, it created an internal and external accountability tool – both the government and the general public became aware of the specific results of the plan and who was responsible for them. However, an important concern is the sustainability of these tools, as the lack of institutionalisation made them ultimately dependent on the will of the President or a very high authority to pursue them.
Further Reading
Angulo, R. (2016). “From multidimensional poverty measurement to multisector public policy for poverty reduction: lessons from the Colombian case.” OPHI Working Paper 102, University of Oxford.
Azevedo, J. P. (2013). “From Noise to Signal: The Successful Turnaround of Poverty Measurement in Colombia.” Economic Premise, May 2013, Number 117, The World Bank.
CONPES (National Council for Social and Economic Policy). 2012. “Metodologías Sociales y Arreglos Institucionales para la Medición de la Pobreza en Colombia.” CONPES Social 150, DNP, Bogotá.
MESEP (Misión para el Empalme de las Series de Empleo, Pobreza
y Desigualdad). 2012. “Pobreza Monetaria en Colombia: Nueva Metodología y cifras 2002–2010; Resultados 2a Fase de la MESEP.” DNP/ DANE. Bogota, Colombia.
Figures
Figure 1:Poverty and Inequality Roundtable
Source: Angulo, R. (2016). “From multidimensional poverty measurement to multisector public policy for poverty reduction: lessons from the Colombian case.” OPHI Working Paper 102, University of Oxford.
Figure 2: Poverty and Inequality Roundtable – Dashboard
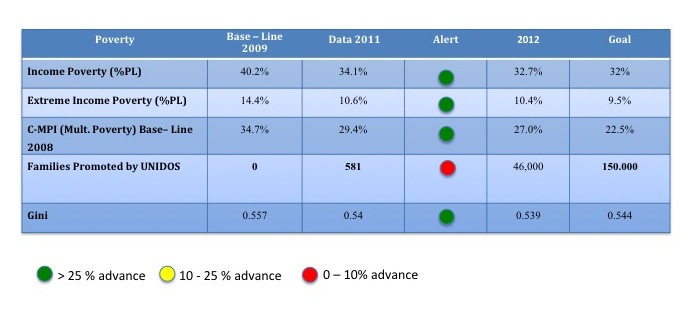
Source: Multidimensional Poverty Index – Applications Colombia. Presentation to the First Multidimensional Poverty Peer Network meeting by Bruce Mac Master, Director of the Department for Social Prosperity. Oxford, June 2013
Figure 3: Poverty and Inequality Roundtable (Sector-specific)
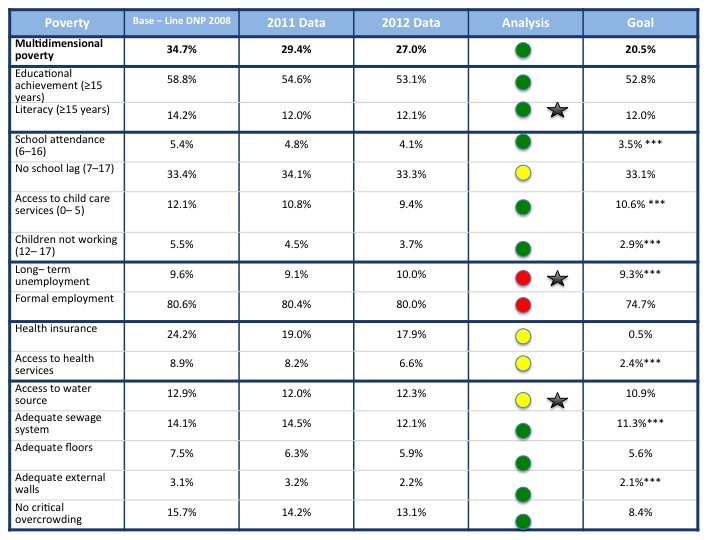
Source: Multidimensional Poverty Index – Applications Colombia. Presentation to the First Multidimensional Poverty Peer Network meeting by Bruce Mac Master, Director of the Department for Social Prosperity. Oxford, June 2013
Figure 4: Alert system timetable (examples)
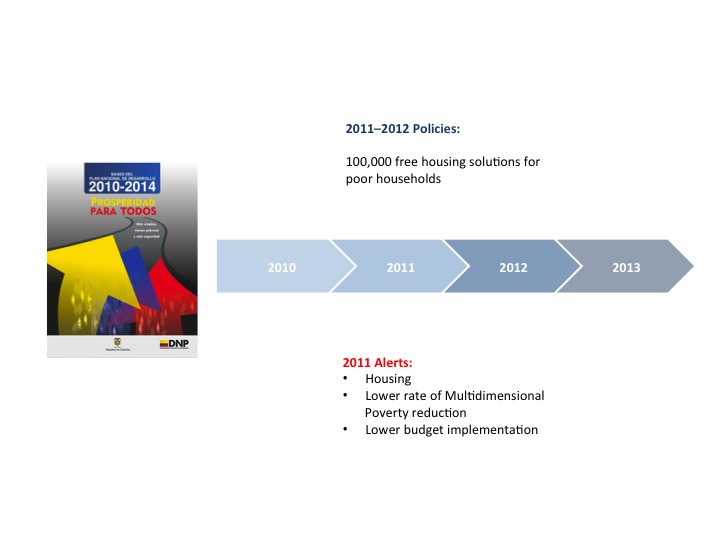
Source: Multidimensional Poverty Index – Applications Colombia. Presentation to the First Multidimensional Poverty Peer Network meeting by Bruce Mac Master, Director of the Department for Social Prosperity. Oxford, June 2013


